The bar graph in Panel (a) shows the proportion of male and female illiterates in 2001 and 2011. The proportions of males and females in 2001 and 2011 are given in Panel (b) and (c)

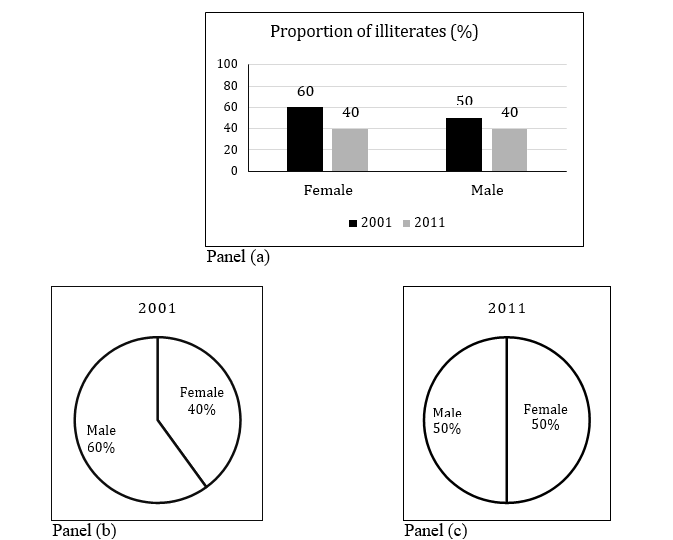
Q. The bar graph in Panel (a) shows the proportion of male and female illiterates in 2001 and 2011. The proportions of males and females in 2001 and 2011 are given in Panel (b) and (c), respectively. The total population did not change during this period. The percentage increase in the total number of literates from 2001 to 2011 is 

A) 30.43                    

(B) 33.43                   

(C) 34.43                  

(D) 35.43

Ans: 30.43

Number of Literates in 2011 = (0.5 × 0.6 × x) + (0.5 × 0.6 × x) = 0.6x

Number of Literates in 2001 = (0.6 × 0.5 × x) + (0.4 × 0.4 × x) = 0.46x

∴ Increase in literates from 2001 to 2011=
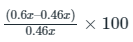
=30.43%

Take Mock Tests

Government Schemes Mock Test Start Test!
Political Science Mock Test – 42 Start Test
History Test – 190 Start Test
Quantitative Aptitude Test Start Test!
Data Interpretation - Mock Test Start Test!
General Awareness - Mock Test Start Test!
Reasoning Ability - Mock Test Start Test!
We will be happy to hear your thoughts

Leave a reply

Gkseries.com
Logo
Register New Account