The given Bar Graph represents the percentages of population in the age groups, X(above 50years), Y(20to 50years), Z(below 20 years) in five different villages, A, B, C, D and E with total population of 5000, 6000, 8000, 4500 and 6000 respectively.
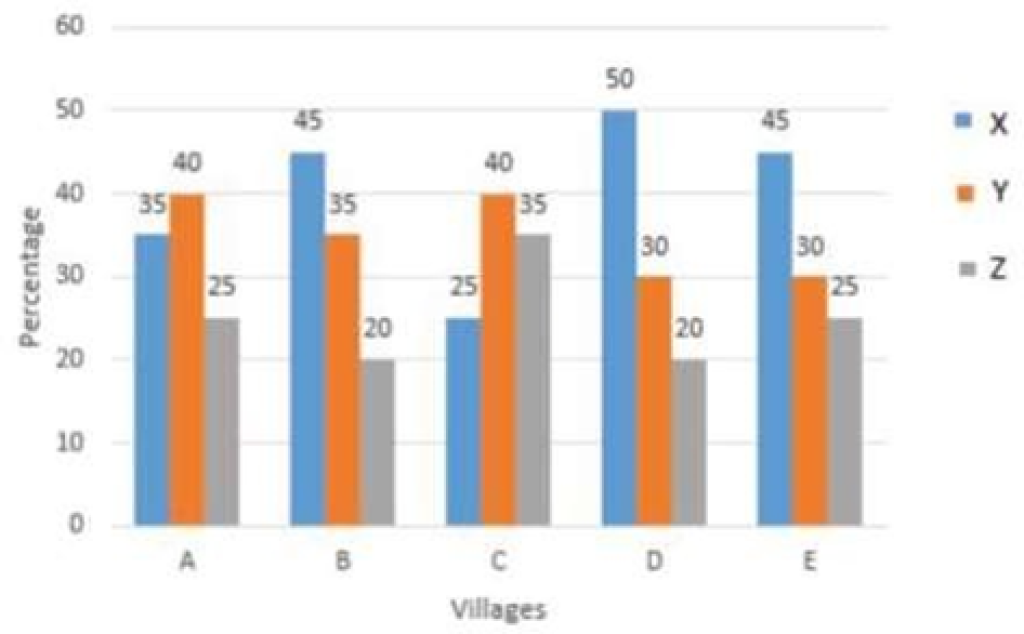
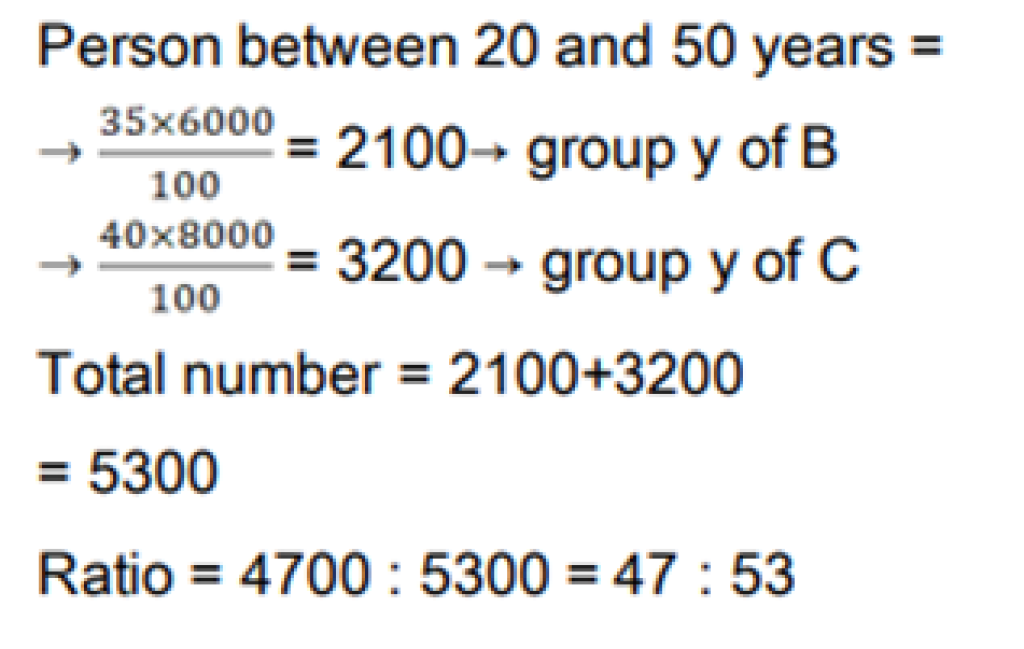
What is the ratio of the total number of persons of ages above 50 years in the villages, B and C, taken together to the total number of persons having ages between 20 and 50 years in the said villages?
(a) 49:57
(b) 47:53
(c) 51:59
(d) 24:27
Sol:
Person above 50 years =
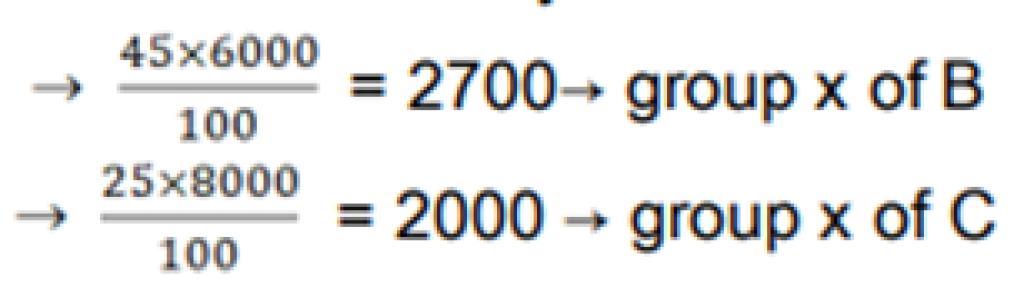
Total number = 2700+2000
=4700