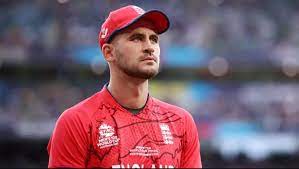
Alex Hales from England announces retirement from International Cricket
Alex Hales from England announces retirement from International Cricket: Alex Hales, 34, has declared his retirement from international cricket with immediate effect. He ends his England career as a T20 World Cup winner, having played his final game in November last year in a five-wicket win against Pakistan at the MCG. Hales, aged 34, was […]
Alex Hales from England announces retirement from International Cricket Read More »

![If 𝑋 and 𝑌 are random variables such that 𝐸[2𝑋 + 𝑌] = 0 and 𝐸[𝑋 + 2𝑌] = 33, then 𝐸[𝑋] + 𝐸[𝑌]](https://www.gkseries.com/blog/wp-content/uploads/2023/08/If-𝑋-and-𝑌-are-random-variables-such-that-𝐸2𝑋-𝑌-0-and-𝐸𝑋-2𝑌-33-then-𝐸𝑋-𝐸𝑌--1024x536.jpg)