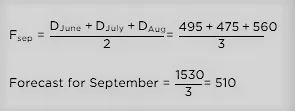
Q. The table presents the demand of a product. By simple three-months moving average method, the demand-forecast of the product for the month of September is
| Month | Demand |
| January | 450 |
| February | 440 |
| March | 460 |
| April | 510 |
| May | 520 |
| June | 495 |
| July | 475 |
| August | 560 |
(A) 490 (B) 510 (C) 530 (D) 536.67
Sol: